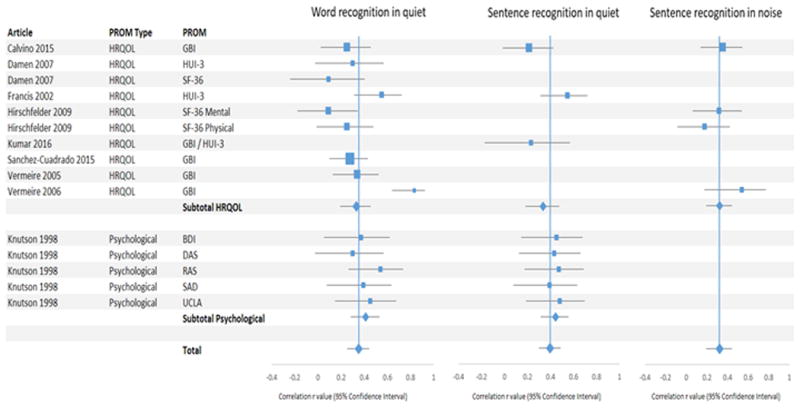
Figure 3. Forest Plot of Meta-analysis of Correlations.

Forest plots pertaining to meta-analysis of correlations for articles reporting health-related QOL (HRQOL) (top) and psychological QOL (bottom) measures. Pooled correlations are represented by diamonds. PROM: patient-reported outcome measure; CI: cochlear implant
