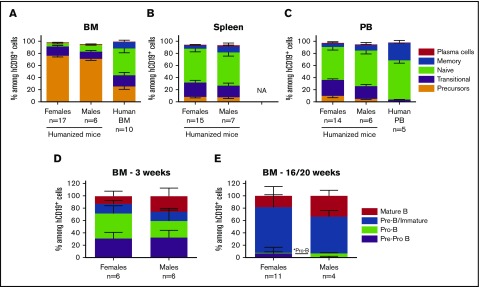
Figure 3.
Comparison of B-cell subpopulations and precursors in female and male recipient mice. Sublethally irradiated NSG and NSG-pct mice were injected with 1.5 × 10⁵ to 2 × 10⁵ BM CD34+ cells and grafted under the kidney capsule with a partially HLA-matched human fetal thymus. (A-C) Mice were euthanized between weeks 16 and 20 after transplantation and BM (n = 17 females and 6 males), spleen (n = 15 females and 7 males), and PB (n = 14 females and 6 males) were collected and analyzed for their B-cell composition. Mean ± SEM of indicated B-cell subpopulation percentages among total CD19+ cells are shown. Animals with less than 1% CD19+ cells were excluded from the analysis. Females in the analysis were reconstituted from 5 to 7 BM donors whereas males were reconstituted from 2 to 3 BM donors. (A) Ten human BM and (C) 5 human PBMC samples were plotted for comparison. (D-E) Mice were euthanized (D) at week 3 (n = 6 females and 6 males) or (E) between weeks 16 and 20 (n = 11 females and 4 males) after transplantation. BM cells were collected, and early B-cell progenitors were analyzed by flow cytometry. Mean + SEM of indicated BM B-cell progenitor percentages among total CD19+ cells are shown. Animals with less than 1% CD19+ cells were excluded from the analysis. *Statistical significance calculated by the nonparametric Mann-Whitney U test used for each B-cell population. NA, not available.

