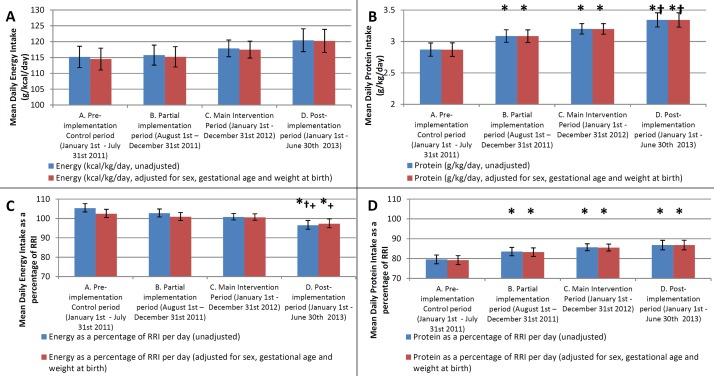
Figure 3.
Bar graphs showing mean daily nutrient intakes across the four study periods. Bars show mean daily energy in kcal/kg/day (A), protein in g/kg/day (B), energy as a percentage of RRI (C) and protein as a percentage of RRI (D). Error bars represent 95% CIs. Blue bars represent unadjusted data, while red bars are adjusted for sex, gestational age and weight at birth. *p<0.05 for difference versus period A, †p<0.05 for difference versus period B,+p<0.05 for difference versus period C. (RRI, reasonable range of intake).

