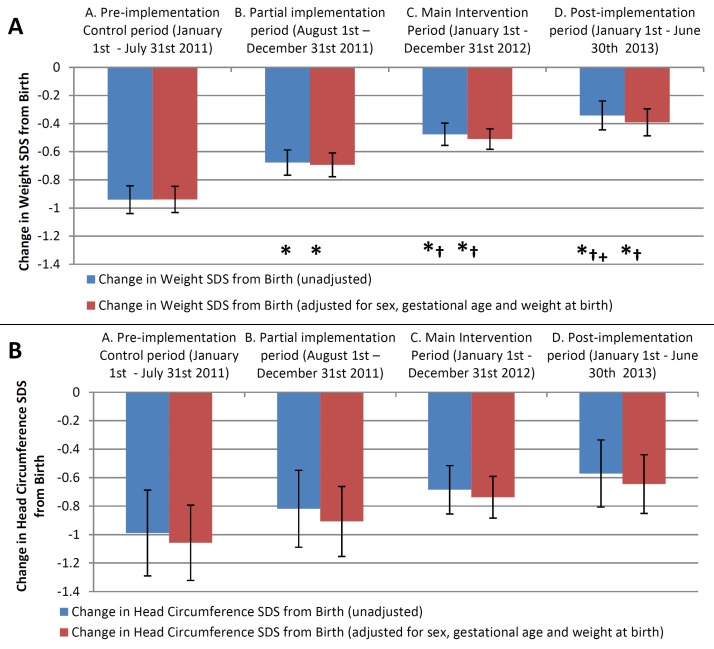
Figure 4.
Bar graphs showing mean change in SD score (SDS) across the four study periods. Changes are from birth until discharge for weight (A) and head circumference (B). Error bars represent 95% CIs. Blue bars represent unadjusted data, while red bars are adjusted for sex, gestational age and weight at birth. *p<0.05 for difference versus period A, †p<0.05 for difference versus period B,+p<0.05 for difference vs period C.

