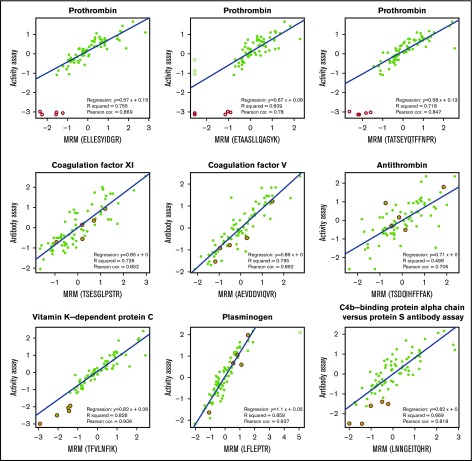
Figure 2.
The correlation between the protein concentrations obtained by MRM and previously obtained activity level for factors II and X. Data are normalized on both axes. Empty symbols are statistical outliers; values originating from patients who used vitamin K antagonists are highlighted in red; the blue line is the regression line. All data points except statistical outliers were considered for the correlations, except for vitamin K–dependent protein C, in which the values in red were also omitted in the calculation of correlation.

