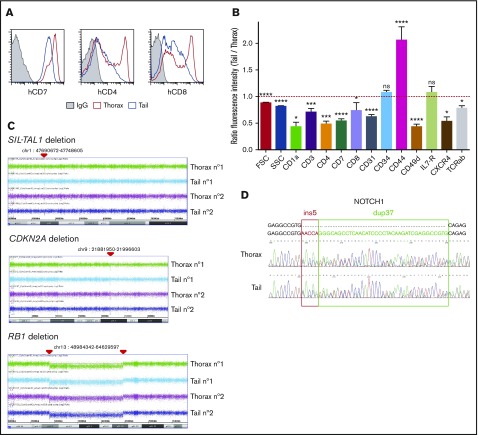
Figure 2.
Phenotype and genomic analyses of tail- and thorax-derived T-ALL. (A) Phenotype comparison of human CD45+ T-ALL isolated from thorax (red line) and tail (blue line) vertebrae from hT-ALL#1. Shown are results from a representative mouse. Other examples are shown in supplemental Figure 2. (B) Ratio fluorescence intensity (RFI) in hT-ALL from tail- vs thorax-derived BM. RFI was calculated using the MFI of tail-derived hT-ALL divided by the MFI of thorax-derived hT-ALL cells. Five hT-ALL (#1-#5) tested, 16 to 20 mice per cell-surface marker. Mean values (± standard error of the mean [SEM]) are indicated. (C) CGH arrays of purified thorax- or tail-derived hT-ALL#1 cells. A 58-kb SIL-TAL1 deletion on 1p32 and 1p33 loci, homozygous CDKN2A deletion on 9p21.3 locus, and homozygous RB1 deletion followed by an heterozygous 54-Mb deletion between 13q14 and 13q21 loci. Representative of 2 mice. CGH arrays of hT-ALL#2 and #4 are provided in supplemental Table 3. (D) Sanger sequencing of NOTCH1 (exon 27) in thorax- and tail-derived hT-ALL#1 (list of primers provided in supplemental Table 2). NOTCH1 mutations of hT-ALL#2 and #4 are provided in supplemental Figure 3. *P < .05; ***P < .001; ****P < .0001; ns, not significant (Mann-Whitney U test).

