Figure 6.
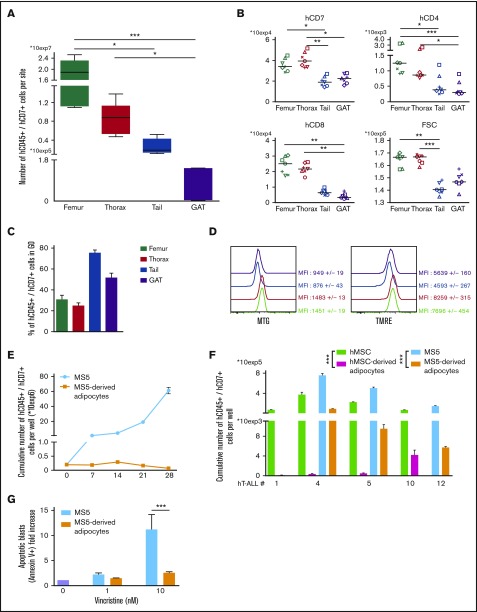
hT-ALL from gonadal adipose tissue and recovered from cocultures with adipocytes share similar features with tail-derived hT-ALL. (A) Leukemic cell numbers recovered from femur, thorax vertebrae, tail vertebrae, and GAT <2 months after hT-ALL#1 transplantation. Shown are boxplots ±SEM of 7 mice receiving 5 × 10⁴ leukemic cells. (B) Levels of cell-surface expression of hCD7, hCD4, and hCD8 markers on hT-ALL#1 recovered from femurs, thorax, tail, and GAT of NSG engrafted mice. Statistics are calculated according to nonparametric Friedman test (*P < .05; **P < .01; ***P < .001). (C) Cell-cycle analysis and (D) metabolism status ([left] MTG; [right] TMRE labeling panels) of hT-ALL#1 leukemic cells recovered from the different tested sites. Data are from 3 mice. (E) Cumulative growth of hT-ALL#10 cells during cocultures with MS5 and MS5-derived adipocytes. (F) Histograms are mean values (± SEM) of hT-ALL (#1, #4, #5, #10, #12) cells cocultures during 7 days on MS5, hMSC, MS5-derived, and hMSC-derived adipocytes. All cocultures were performed in triplicate. (G) Apoptosis levels of hT-ALL during cocultures with MS5 (blue) or MS5-derived adipocytes (orange) in presence of 1 to 10 nM vincristine. Histograms provide vincristine-induced apoptosis (calculated as ratio of % Annexin V+ cells with vincristine over the spontaneous apoptosis [ie, without vincristine]). Shown are results from 3 experiments performed with 2 hT-ALL samples tested in triplicate. Statistics in panel G are calculated according to nonparametric Mann-Whitney U test; ***P < .001.

