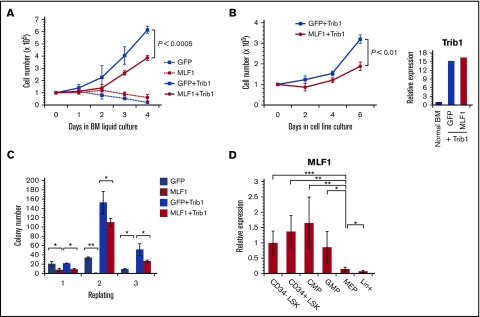
Figure 3.
MLF1 suppresses the Trib1-induced growth advantage of hematopoietic cells and is expressed in normal hematopoiesis. (A-C) Primary BM cells were infected with control GFP and MLF1-IRES-GFP retroviruses together with or without pMSCV-neo-Trib1. GFP-positive cells in infected BM cells were isolated by cell sorting and maintained in BM medium. Cell numbers were enumerated for growth curves (A). GFP-positive cells in panel A were transferred to and maintained in IL-3–containing medium. Cell numbers were enumerated for growth curves (B). GFP-positive cells in infected BM cells were isolated by cell sorting and plated in a methylcellulose-based medium. Colony numbers were enumerated after 10 days and replated in fresh medium for the replating colony formation assay (C). Data are averages of 3 independent experiments performed in duplicate and shown as the mean value (± standard deviation). Significance was calculated by Student t test (*P < .05; **P < .01). (D) A qRT-PCR analysis of Mlf1 expression in purified hematopoietic stem and progenitor cells. ΔCt values for each sample were standardized by the ΔCt values of β-actin. Data are the average of 4 independent experiments shown as the mean value (± standard deviation). Significance was calculated by Student t test (*P < .05; **P < .01; ***P < .001).

