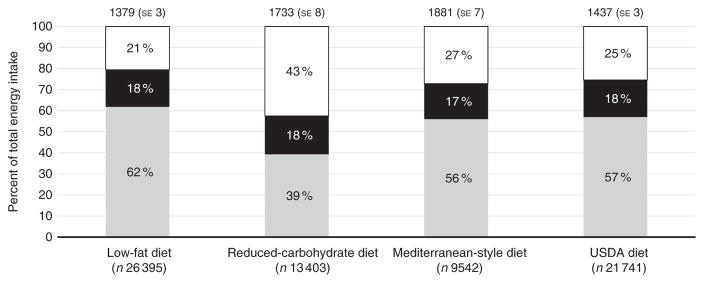
Fig. 1.
Total energy intake and percentage of total energy from carbohydrates (
 ), fat (■) and protein (□) among high adherers of a low-fat diet, a reduced-carbohydrate diet, a Mediterranean-style diet and a diet consistent with the US Department of Agriculture’s (USDA) Dietary Guidelines for Americans. Total energy intake is given as mean values with their standard errors. Percentages given represent the percent of mean total energy intake. Data are from the Women’s Health Observational Study.

