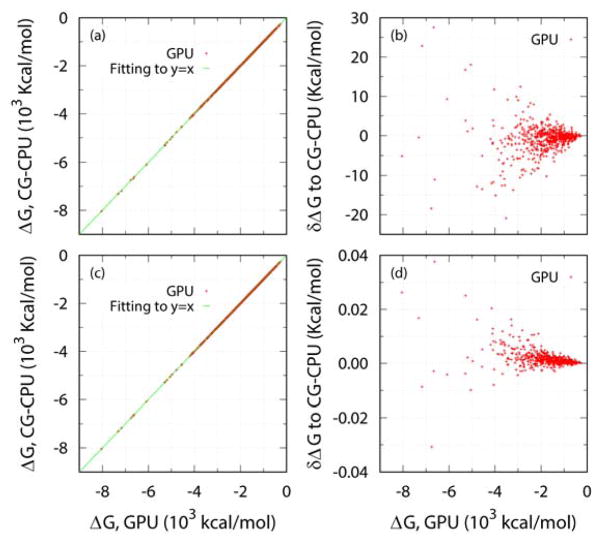
Figure 2.
Correlations (a), (c) and differences (b), (d) of electrostatic solvation energies on GPU (Jacobi with CUSP library and DIA matrix format) and on CPU (CG) for the protein test set. The periodic boundary condition (PBC) was used. The convergence criterion was set to 10−3 (a), (b) and 10−6 (c), (d). The linear regression slopes are 0.999639 and 1.0 for 10−3 and 10−6 criterion respectively, and the correlation coefficients are 1.0 for both.

