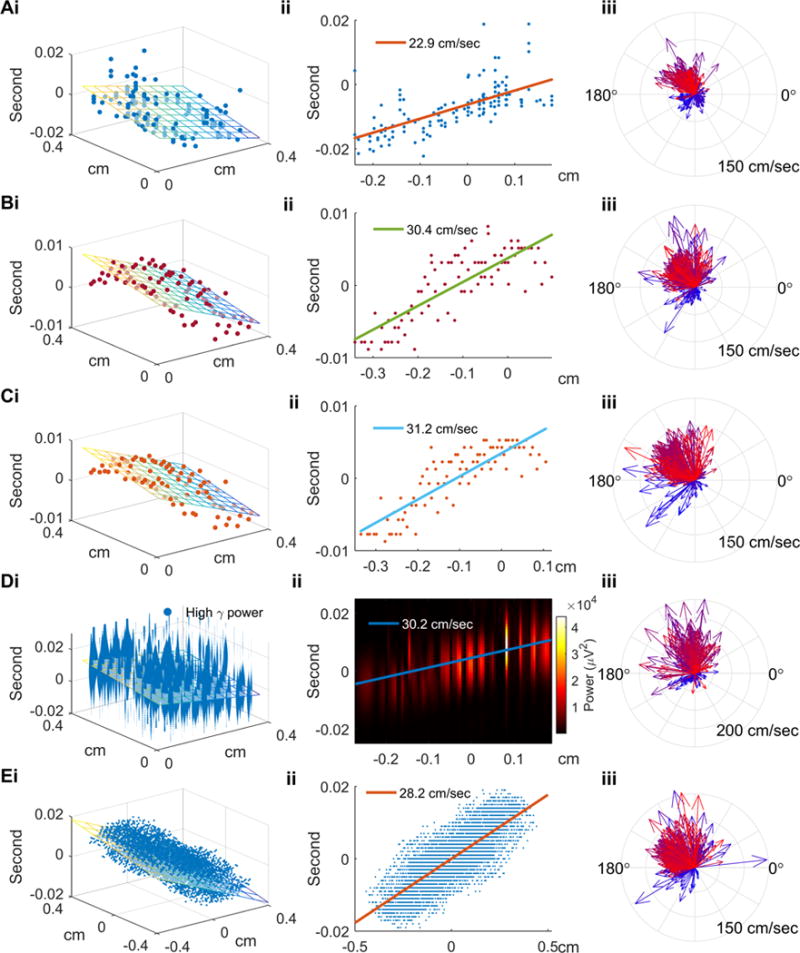
Figure 2. Multiunit and LFP-based methods of determining speed and direction of ictal discharges.

(Ai) Spatiotemporal distribution of multiunit spikes of the example ictal discharge from Figure 1B. The discharge is used for illustrative purposes for all figure panels’ section ‘i’. Physical locations and timings of multiunit spikes are scattered along the regression plane (F-test, p ≪ 0.001). (Aii) The projection of multiunit spike timings along the regression plane’s gradient (propagation axis). Traveling wave speed, determined from the slope, is 22.9 cm/sec. (Aiii) Velocities of all discharges detected from Patient A, seizure 3, with temporal information color coded as in Figure 1A. The comparison of the first 25% (bluish) and the last 25% (reddish) ictal discharges illustrates the previously-reported pronounced direction shift and acceleration (see text for detailed statistics). (Bi) Regression analysis for the example discharge using timings derived from the negative peak method. Least squares linear regression was applied to recover its propagation axis and speed (colored plane, activation sequence as blue to yellow). (Bii) The projection along the propagation axis versus timings of the negative peaks. (Biii) Similar to Aiii using the negative peak method applied to all discharges from Patient A, seizure 3. The speed increase and direction shift from early to late seizure periods are again seen. (Ci–iii) Similar to Bi–iii, with timing determined using the maximal descent method. (Di–iii) Similar to Bi–iii and Ci–iii with timing determined using high gamma power. Panels i and ii show the sequential pattern of instantaneous high gamma power along the propagation axis (permutation test, p < 0.005). (Ei–iii) Similar to above, using the cross-correlation method (permutation test, p < 0.005).
