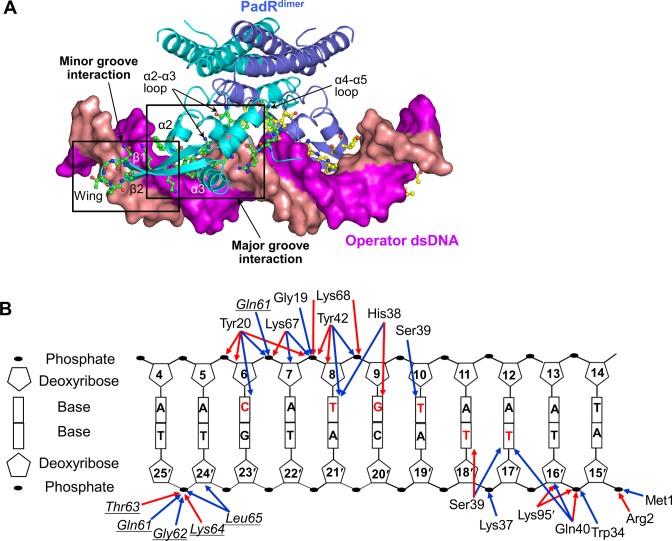
Figure 2.
PadR–dsDNA interaction observed in the PadRdsDNA structure. (A) Overall PadRdsDNA structure. PadRdimer is depicted as ribbons (cyan and light blue), and the dsDNA is shown as a surface representation (magenta and salmon). PadR residues located in the binding interface are shown as ball-and-stick models (green and yellow). (B) A schematic diagram of the PadR–dsDNA interaction. Red and blue arrows indicate hydrogen bonds and van der Waals interactions, respectively. PadR residues in the minor groove interaction site are shown in italics and are underlined to differentiate them from the residues of the major groove interaction site. DNA bases that PadR makes contacts with are labeled in red.

