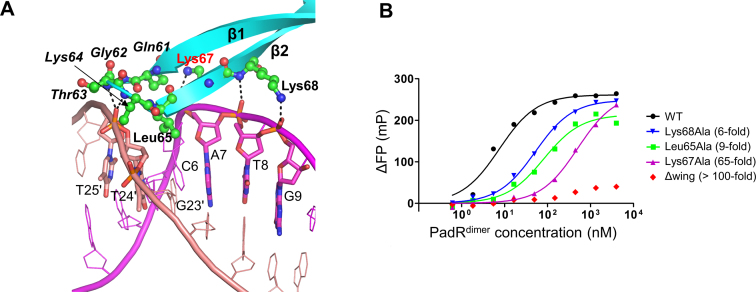
Figure 4.
Minor groove and boundary interaction sites and their mutational analysis. (A) Minor groove and boundary interactions in the PadRdsDNA structure. PadR is shown as cyan ribbons, and its DNA-binding residues are depicted as green ball-and-stick models. PadR residues in the minor groove interaction site are shown in italics. Lys67, which plays a key role in DNA binding, is labeled in red. The dsDNA is colored in magenta and salmon for the leading and non-leading strands, respectively, and its PadR-interacting residues are shown as sticks. Hydrogen bonds are represented by dotted lines. (B) FP analysis of the interaction between PadR WT or mutants (Leu65Ala, Lys67Ala, Lys68Ala and Δwing) and the operator dsDNA. The affinity differences between the mutants and the WT are shown in parentheses. The data are representative of at least three independent experiments that yielded similar results.

