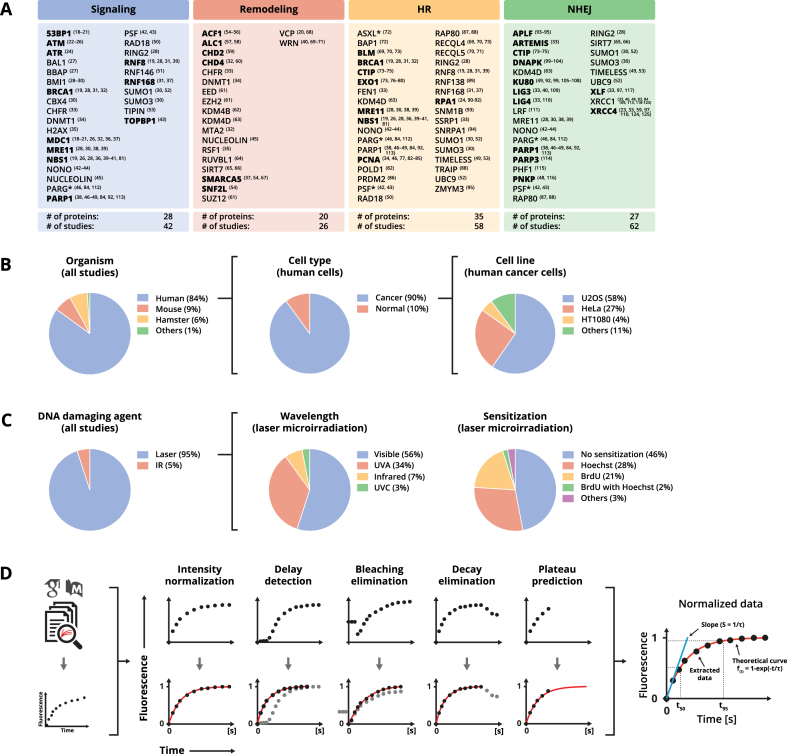
Figure 1.
Overview of the data analyzed in this study. (A) A table listing all analyzed proteins, ordered per pathway. References to studies that analyzed each individual protein are indicated in brackets. Core factors of each pathway are marked in bold. (B and C) Statistical overview of the analyzed data, showing the origin, type and line of cells used in the studies (B) and the applied DNA-damage induction methods (C). (D) Schematic overview of the data processing procedures. See the ‘Materials and Methods’ section for detailed description. * The involvement of these proteins in the indicated DSBR pathways is not well documented in the available literature.

