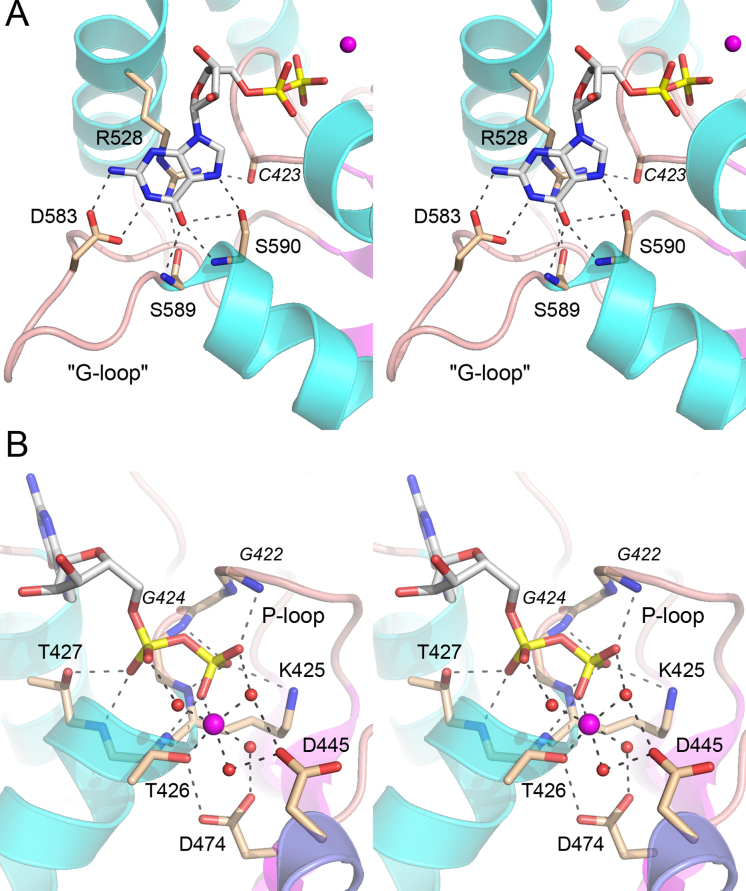
Figure 3.
Interactions with the guanine nucleobase, GDP phosphates, and magnesium. (A) Stereo view of the G-loop highlighting KIN interactions with the guanine nucleobase. (B) Stereo view of the P-loop highlighting contacts to the GDP phosphates and magnesium. Amino acids and GDP are shown as stick models with beige and gray carbons, respectively. Mg2+ is depicted a magenta sphere in the center of an octahedral coordination complex. Waters in the metal coordination complex are denoted by red spheres. Atomic contacts are indicated by dashed lines.

