Figure 4.
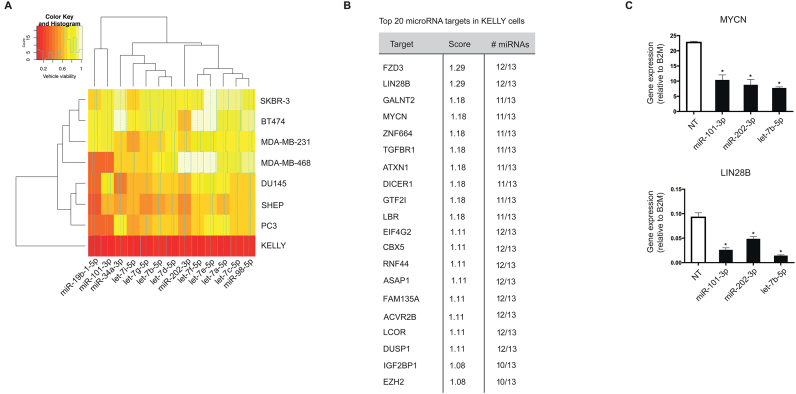
Validation of the screening and data analysis pipeline. (A) A heatmap showing the lethal effect (normalized viability values) of the miRNAs known to affect neuroblastoma survival through targeting MYCN. Red color signifies strong lethal effect and white color no effect on cell survival. (B) The list of top 20 targets most commonly shared between these miRNAs as computed by our database. The targets were ranked according to the strength of predictions and filtered based on their expression levels in KELLYs (RPKM > 1). (C) KELLY cells were transfected with let-7b-5p, miR-101-3, miR-202-3p or NT, and changes in mRNA levels of MYCN and LIN28B were assessed using qPCR. B2M was used as a housekeeping gene. The graph plots gene expression (dCt expression) relative to B2M and is representative of three independent experiments. The significance was determined using one-way ANOVA with Dunnett’s multiple comparisons test (n = 3, *P-value ≤ 0.05).

