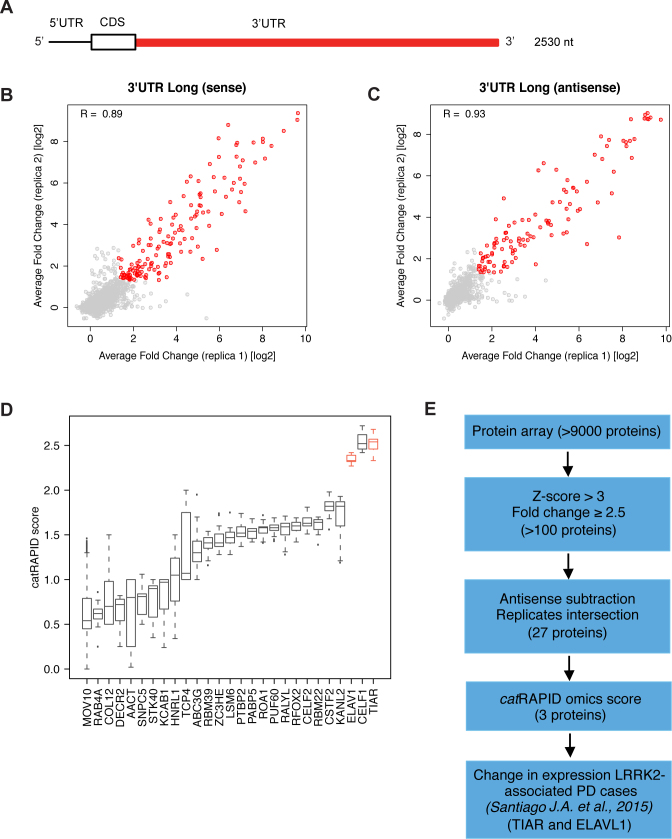
Figure 1.
Large scale screening of SNCA 3′UTR protein interactors. (A) SNCA 3′UTR long (3′UTR L) used in our experiments in vitro; Pearson's correlation between two protein array replicates probed with (A) 3′UTR L sense and (B) antisense (right) RNAs. (sense: R = 0.89; (C) antisense: R = 0.93). Selected binders with fold change (signal to background ratio) >2.5 and associated Z-score > 3 are represented as red dots, while less significant binders are reported in grey. (D) Median value of catRAPID score of SNCA 3′UTR top interactors: 27 proteins; TIAR (also known as TIAL1) and ELAVL1 (ELAV1) are highlighted in red). (E) Sketch of the in vitro / in silico procedure followed to identify TIAR and ELAVL1 interactions.

