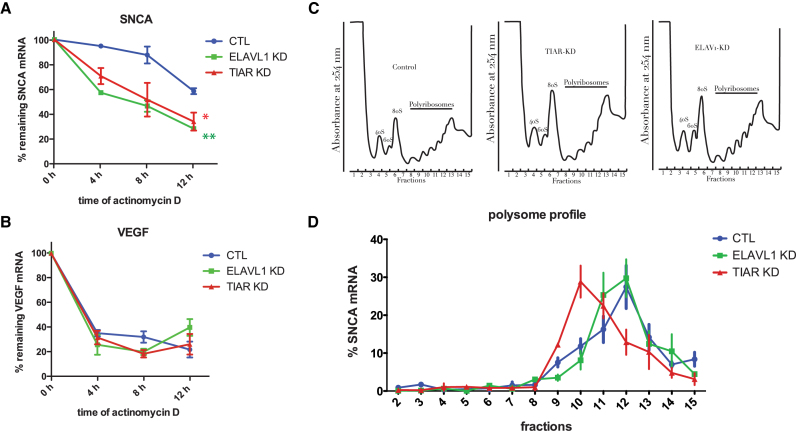
Figure 6.
TIAR and ELAVL1 role in SNCA mRNA stability and translation. (A) Percentage of remaining SNCA mRNA measured at 0, 4, 8 and 12 h after transcription inhibition with actinomycin D in control, TIAR knockdown and ELAVL1 knockdown HeLa cells. Mean and standard deviation of three independent experiments are shown (Kolmogorov-Smirnov test with respect to control curve, *P-value < 0.1; **P-value < 0.01). (B) VEGF mRNA is a control for the effectiveness of the actinomycin D treatment. (C) Polysome profile of HeLa control, TIAR knockdown and ELAVL1 knockdown cells. (D) Percentage of SNCA mRNA distribution across polysome gradient in HeLa control, TIAR knockdown and ELAVL1 knockdown conditions. Data shown are mean with standard deviation of three independent experiments.

