Figure 9.
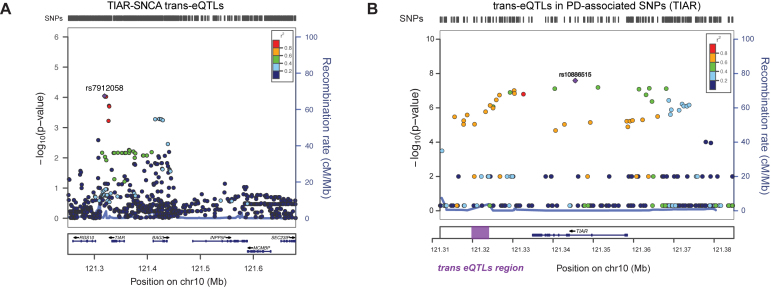
SNCAtrans expression Quantitative Trait Loci (trans-eQTLs) analysis of TIAR and ELAVL1. (A) SNCAtrans-eQTLs analysis in the region chr10:121250246–121682830 (hg19) spanning from 84 kb upstream TIAR gene to 94 kb downstream neighboring INPP5F gene. The analysis, performed using GTEX data available for human hippocampus tissue (n = 81), shows highly significant SNCA trans-eQTLs P-values (P-values < 10−9) for a group of SNPs downstream TIAR gene (red and purple dots). A locus zoom graph shows that the significant SNCA trans-eQTLs in TIAR region present the typical pattern of linkage disequilibrium (LD) decay of association signals, with a top-associated SNP and other surrounding associated SNPs in progressively decaying LD values (‘Recombination rate’ on right y-axes). (B) PD-associated SNPs from previous GWAS studies (58) in the genomic region of chromosome 10 including TIAR gene. The –log(P-value) is represented on the left y-axes, while the ‘recombination rate’ is represented on the right y-axes. The region downstream TIAR locus where significant SNCA trans-eQTLs map is highlighted with a purple rectangle.

