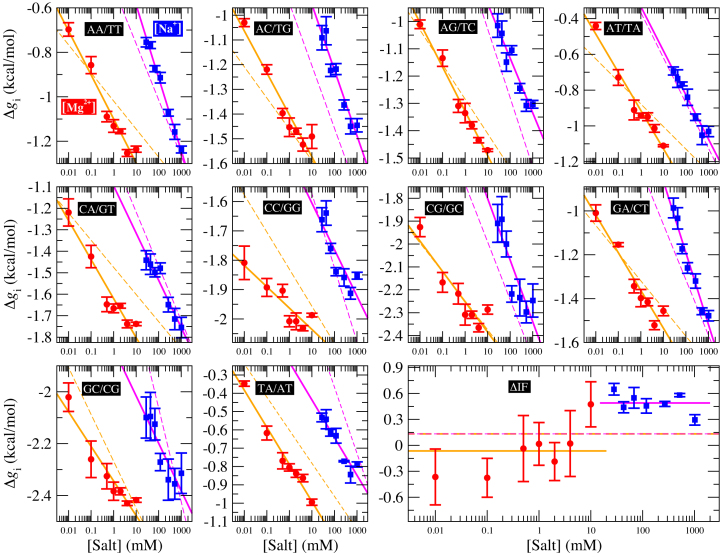
Figure 2.
Heterogeneous salt corrections to NNBP energies and the IF. Each panel shows the energy of an NN motif at 298K. The lower right panel shows the initiation factor energy difference  . Blue points show the experimental results of unzipping at different Na+ concentrations, while red points show the same results for different Mg2+ concentrations. Straight lines show the fits to Equation (1) and dotted lines show the UO prediction. Magenta (orange) lines are fits to Na+ (Mg2+) data. The values of the results show the mean and the standard error.

