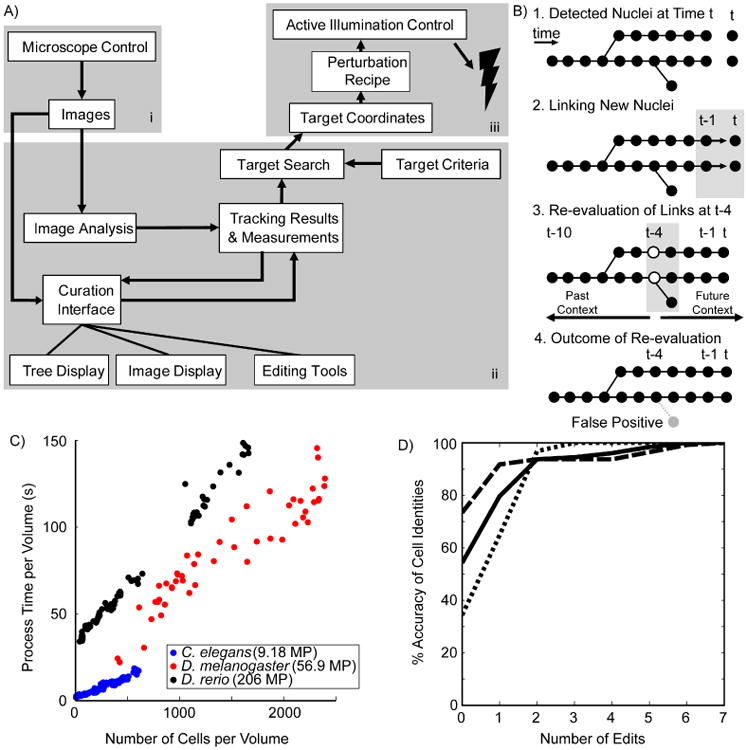
Figure 1. ShootingStar platform.

A) A schematic representation of data flow in the ShootingStar pipeline. i) Microscope control; ii) Tracking software and interfaces; iii) Perturbation control. B) Schematic illustration of the four primary steps of cell tracking in ShootingStar. Circles indicate cells detected at a particular time point. C) Per-volume processing times for images acquired of three species; C. elegans (blue), D. melanogaster (red) and D. rerio (black). MP stands for megapixels. D) Cumulative accuracy of cell identities in tracking each of three C. elegans embryos (solid, dashed and dotted lines. N= 3, 256 cells each).
