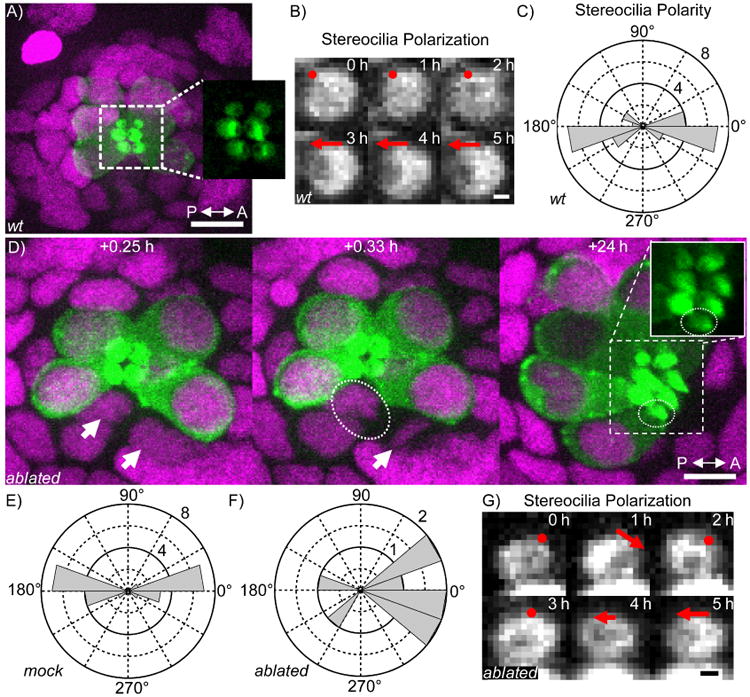
Figure 3. Automated ablation of hair cells in zebrafish neuromasts.

A) Max projection of a single neuromast in a 3 dpf D. rerio larva expressing cldnb∷H2B∷mCherry (magenta) and myo6b∷β-actin∷GFP (green). Inset shows expanded view of the GFP-labeled hair cell stereocilia. wt, wild-type. The scale bar represents 10 μm. B) Time series of polarity establishment in wild-type hair cell visualized by β-actin∷GFP. Red dot indicates no evident polarity, red arrow indicates polarity. The scale bar represents 0.5 μm. C) Distribution of hair cell polarity in wild-type neuromasts (N=26). D) Example sequence from the automated ablation of a hair cell (white arrow) and the subsequent maturation of the surviving sister (dashed ovals). The scale bar represents 10 μm. E) Distribution of hair cell polarity in mock-ablated neuromasts where a neighboring mature hair cell was ablated instead of one of the two newly born hair cells. (N=24). F) Distribution of polarity in hair cells whose siblings were ablated soon after birth (N=9). G) Time series of early polarization in a hair cell whose sibling was ablated soon after birth. Annotations as in (B). The scale bar represents 0.5 μm.
