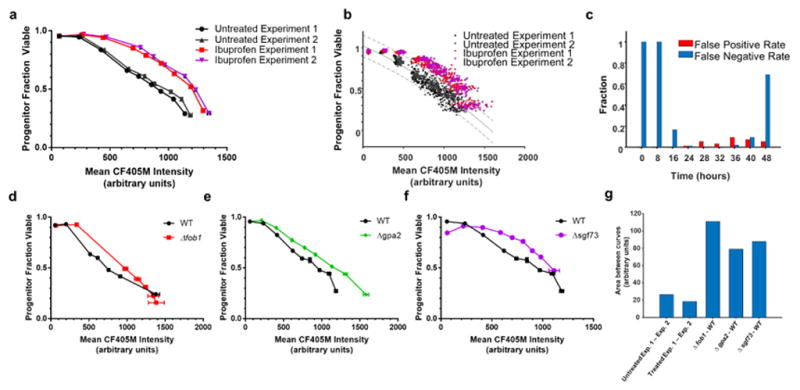
Fig. 3. Detection of lifespan extension using High-Life.

a. Fraction of progenitor cells viable plotted against the corresponding blue fluorescence intensity, with timepoints taken at 0, 8, 16, 24, 28, 32, 36, 40, and 48 hours after labeling. Two separate experiments are shown, each comparing ibuprofen treated samples to an untreated control. Error bars are S.E.M. of 48 replicate wells. b. A plot of the individual replicate points that compose the mean values shown in Figure 3a. The solid line is the result of second order polynomial fitting on pooled data from both untreated experiments; the dashed lines denote a 95% confidence interval. c. The fraction of wells in the ibuprofen condition that fall below the upper boundary of the 95% confidence interval (false negatives), and fraction of untreated wells that fall above the upper boundary of the 95% confidence interval (false positives) at each timepoint sampled. d–f. Fraction of progenitor cells viable plotted against the corresponding blue fluorescence intensity for wild-type, Δfob1 (d), Δgpa2 (e), and Δsgf73 (f) strains sampled at various times after labeling. Error bars are S.E.M. of 12 independent replicates. g. Areas between the curve for High-Life experiments performed under the same conditions (left), or with strains expected to exhibit lifespan differences (right). For consistent comparison, areas between the respective curves were computed with Mean CF405M Intensity ranging from 70 to 1100.
