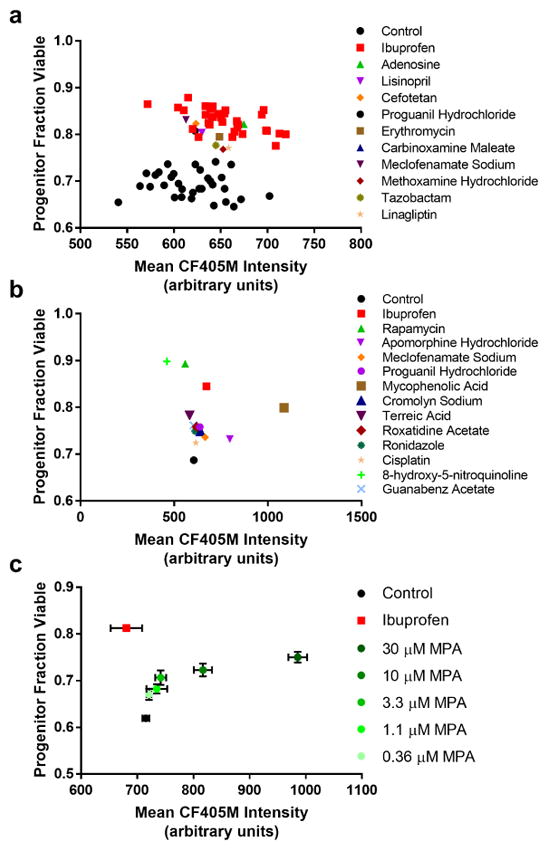
Fig. 4. Plate-based screening using High-Life.

a. A plot of progenitor fraction viable versus CF405M intensity for individual wells of a 384 well plate based screen. Shown for a single plate are all untreated (DMSO) negative control samples, all ibuprofen-treated positive control samples, and all compounds from this plate that were selected for follow-up. b. A plot of progenitor fraction viable versus CF405M intensity for the averages of all wells for control, ibuprofen, and confirmed hit compounds. Error bars are not shown, as S.E.M. bars were generally smaller than the points themselves. Control points are the average of 28 replicate wells; compound points are the average of 3–4 replicate wells. c. Dose-response for cells treated with mycophenolic acid (MPA) during 24 hours of culture, chosen as a representative of the three compounds with clear concentration-dependent effects selected for follow-up validation. Error bars are S.E.M. for four or more replicate wells. See Supplementary Figure 1 for dose-response of additional compounds.
