Fig 6.

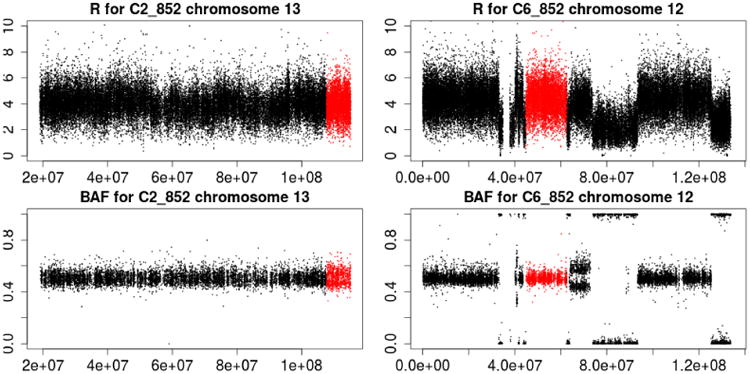
Illustration of estimating the BAF. In the left panel, the highlighted region (in grey) correspond to an allelic imbalance. In the right panel, the highlighted region (in grey) does not have an allelic imbalance.

Illustration of estimating the BAF. In the left panel, the highlighted region (in grey) correspond to an allelic imbalance. In the right panel, the highlighted region (in grey) does not have an allelic imbalance.