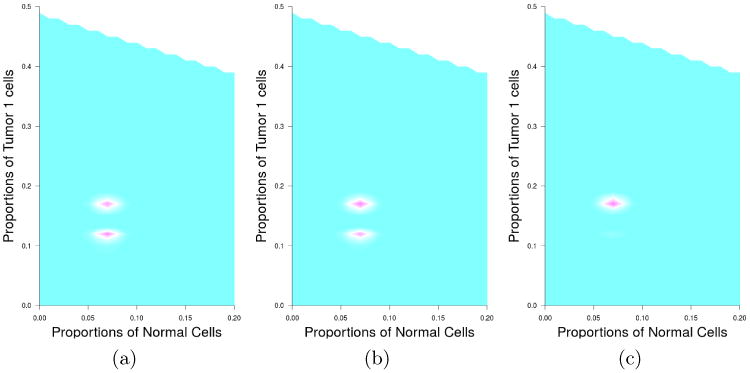
Fig 7.

Contour plots of the posterior probabilities of tumor mixture estimation under different prior choices. The left figure shows the contour plot without incorporating prior information. The middle figure shows the contour plot with weak prior information (b = 0.001), and the right figure shows the contour plot with stronger prior information (b = 0.01).
