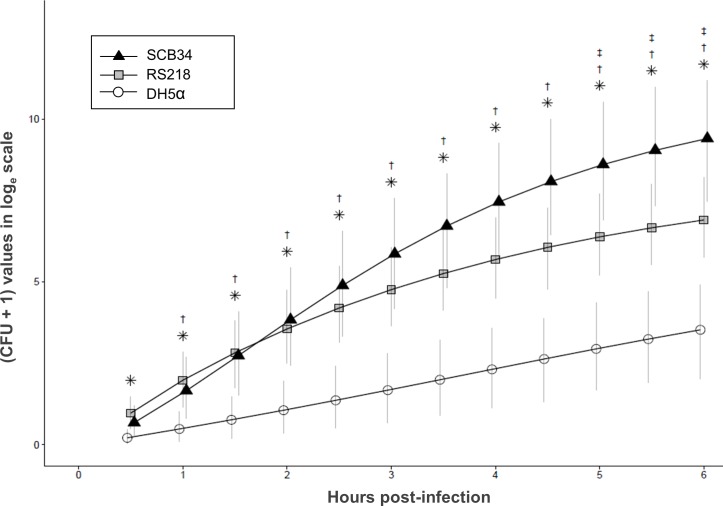
Fig 3. Transcytosis of E. coli clinical isolates across polarized intestinal epithelial cells.
*p<0.05 RS218 vs. DH5−α; † p<0.05 SCB34 vs. DH5−α; ‡ p<0.05 SCB34 vs. RS218. Model−calculated mean of cumulative loge (CFU+1) values over time are shown. Error bars reflect 95% Bayesian confidence intervals. Points were jittered to improve clarity (combined data from three separate experiments).

