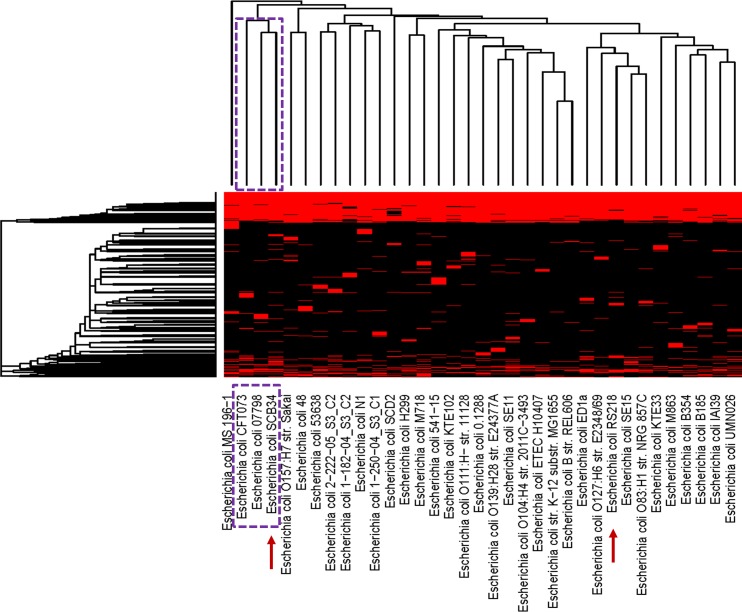
Fig 6. Heat map comparing clusters of genes present (red) or absent (black) in each E. coli genome.
SCB34 and RS218 are highlighted by the arrows, among 33 additional representative E. coli strains. The dotted-line boxes highlight the clade that includes SCB34, and the names of the two additional E. coli strains with the most similar protein-coding sequences within the clade. A hierarchical clustering of the genes found in all genomes is found at the left of the heat map, while a tree based on hierarchical clustering of genomes is shown at the top of the heat map.

