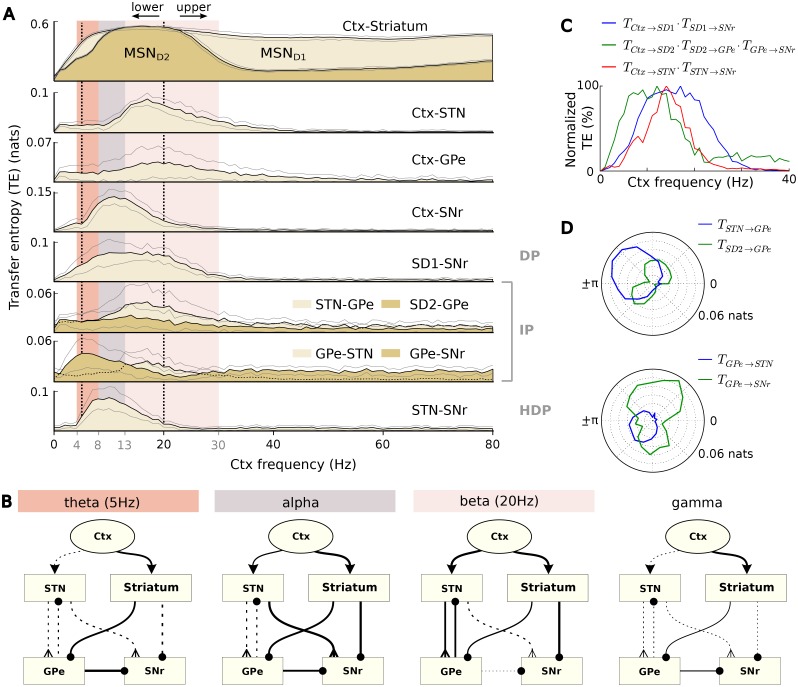
Fig 5. Effective connectivity of the BG model.
A: Spectrum of TE for the connections of the BG circuit. DP, IP and HDP stand for the direct, indirect and hyper-direct pathways respectively. The plotted black and gray lines represent mean and standard deviation respectively, calculated over 100 10-second simulations for each value of cortical frequency. The vertical black dashed lines highlight the exact frequencies that were used in (B). B: Resulting effective connectivity of the BG for different cortical frequency ranges. For the theta and beta bands, only the representative frequencies 5Hz and 20Hz were used respectively, as the system exhibited different behaviours across these two ranges. Thickness of synaptic connections represents TE (normalized across the frequency spectrum) and the solid lines show the dominating pathways. C: Activation of the three main BG pathways for different cortical frequencies. D: TE of GPe afferents versus efferents, for different phase offsets ϕ and alpha cortical rhythms. When 0 ≤ ϕ ≤ π, oscillation peaks in the phasic cortical channel precede in time oscillation peaks in the tonic channel.

