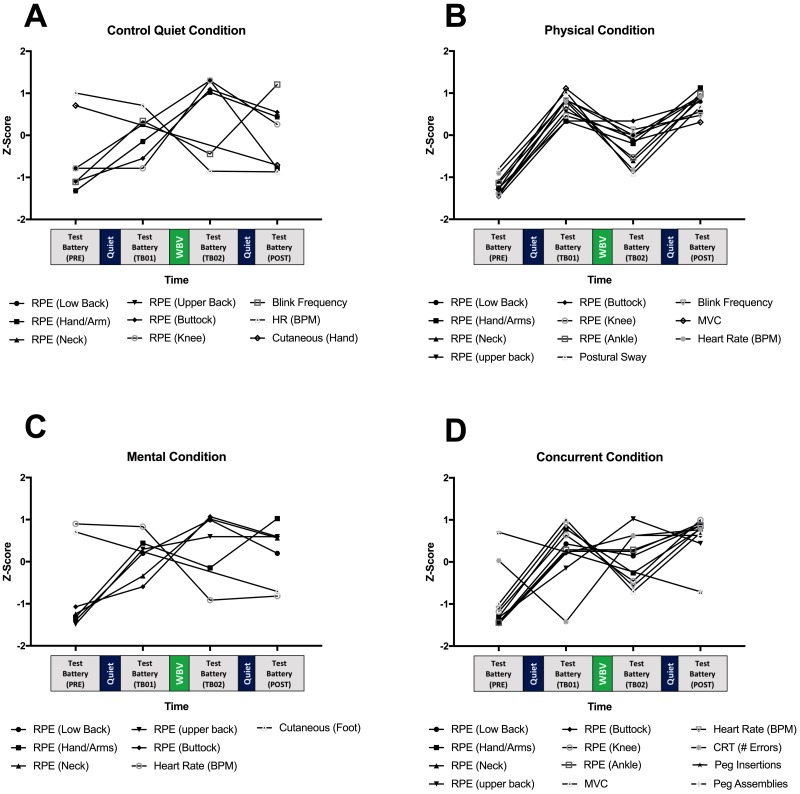
Fig 3. Visualization of trends of measures demonstrating statistically significant time effects.
Values standardized to z-values to visualize trends of measures for each condition. Data plotted over time at intervals of time at which a test battery was collected (cutaneous sensation and Purdue pegboard test limited to Pre-and Post). Increase z-value score indicate increasing fatigue based on conventional interpretation of each measure. Decrease z-value score indicate decreasing fatigue. (A) Control Condition. (B) Physical Condition. (C) Mental Condition. (D) Concurrent Condition. Statistical post-hoc comparisons between time periods were shown in Table 3.

