
Fig 5. Changes in mucin transcription in response to an acute stressor.
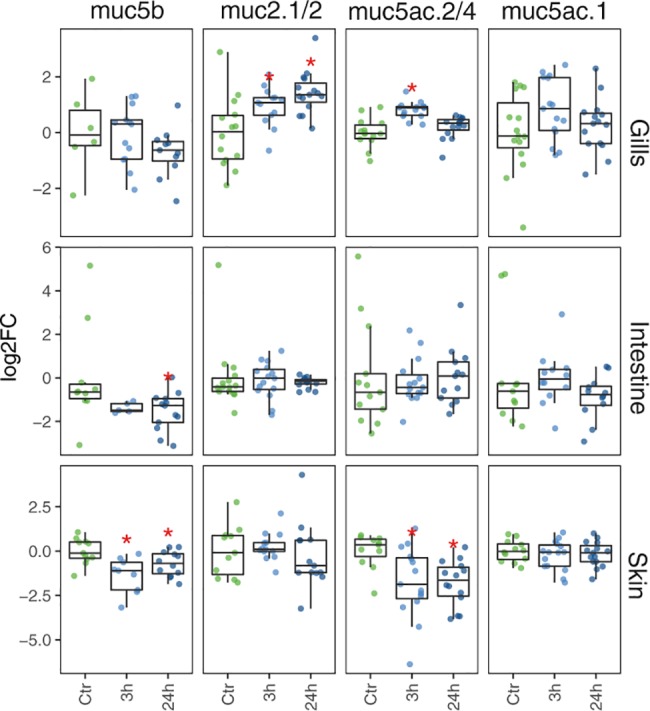
Differential transcription of mucin genes in gill, middle intestine and skin in response to handling stress (n = 15). On the X-axis, control (C), three hours post stress (h3) and twenty-four hours post stress (h24). The box-plot representation shows the median value of mRNA transcription (bold line), the lower and upper limits of each box representing the first and third quartiles, respectively. Whiskers represent the limits of extreme measurements. Transcription is displayed as log2 fold changes relative to the mean transcription of the mucin gene in the control group of the respective tissue. A red asterisk indicates that the marked group is significantly different compared to the control group (t.test; p.value < 0.05).