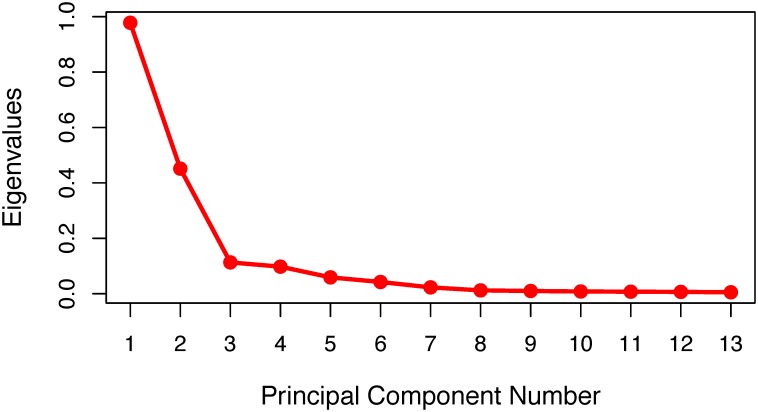
Fig 6. Scree plot of principal component analysis.
The number of principal components (PCs) is on the x-axis and the associated eigenvalues–which indicate the amount of variance yet unexplained–are on the y-axis. The optimal number of principal components to explain the variation found in the genotype is found by visually determining the largest point of inflection, or “elbow” of the non-linear trend line [64].

