
Fig 9. Fixation index values across the genome.
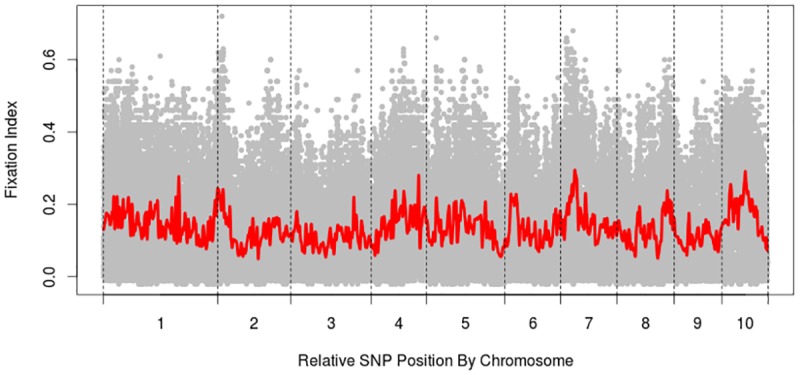
Relative SNP position by chromosome (x-axis) and fixation index (y-axis). Each grey dot represents the fixation index statistic (FST) for an individual genetic locus. High FST value for a genetic locus may indicate that particular genetic locus contributed to genetic differentiation between heterotic groups. The red trend line represents a moving average across a window of 70 SNPs, or approximately 3570 Mb. This red line is representative, then, of the FST values across genomic regions. Peaks observed in the trend line, particularly in chromosomes 1, 4, 7, and 10, may be indicative of lengthy genomic regions contributing to heterosis observed in hybrid crosses between inbreds from different heterotic groups.