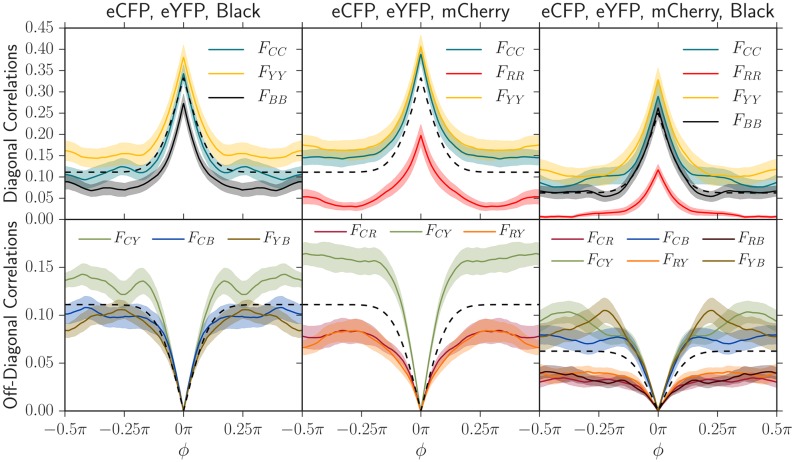
Fig 3. Two-point angular correlation functions Fij(L, ϕ) at a length expanded of L = R − R0 = 6.5 mm (R = 10 mm, R0 = 3.5 mm) in three sets of experiments where we inoculated 20 replicates with equal fractions of our eCFP, eYFP, and black strains (left), then eCFP, eYFP, and mCherry (center), and finally all four strains (right).
The shaded regions in these plots indicate standard errors of the mean. Using the measured diffusion coefficient Dw and initial radius where domain walls form R0 (see Table 2), we also plot the theoretical neutral two-point correlation functions (black dashed line; see eq. (S1.3)). The colors of each plotted correlation function were chosen to correspond to their composite strain colors; for example, two-point correlation correlation functions associated with mCherry were red or were blended with red. The subscripts correspond to the color of each strain: C = eCFP, Y = eYFP, R = mCherry, and B = Black. As judged by the magnitude of the deviation from neutral predictions, the black strain has a small selective disadvantage relative to eCFP and eYFP and the mCherry strain has an even greater disadvantage, in agreement with the independent radial expansion velocities of each strain (see Table 1).

