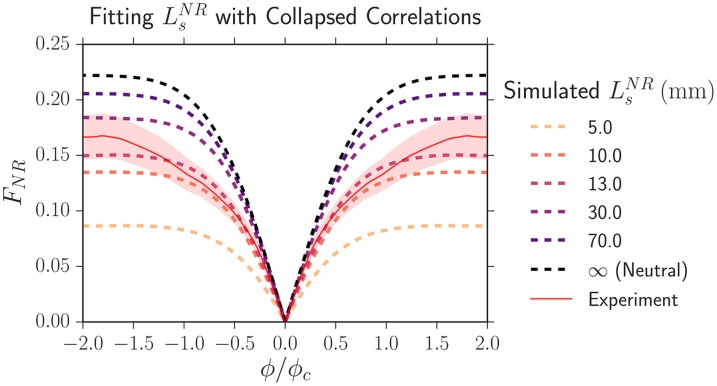
Fig 7. The collapsed two-point correlation function FNR between our eCFP/eYFP strain (N) and our mCherry strain (R), which were inoculated at fractions of 2/3 and 1/3, respectively, at a length expanded of L = 6.5 mm.
The solid red line is experimental data and the shaded region is its standard error of the mean. The dashed lines are the simulated universal correlation functions corresponding to different values of . The best fitting selection length scale is .

