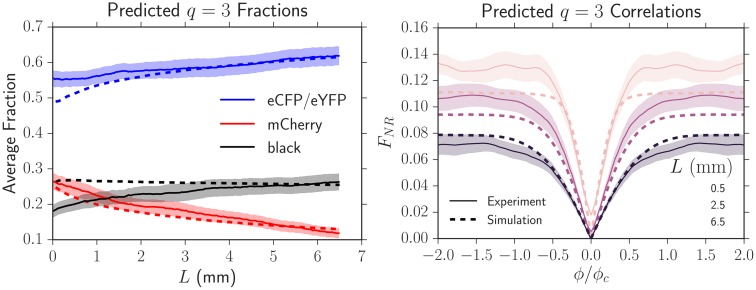
Fig 9. Experimental average fractions and two-point correlation functions (solid lines) of the four strains grown together with equal initial proportions and their predicted dynamics (dashed lines) from simulations using the set of , κij, and ϕc measured in independent experiments.
No additional fitting parameters were used. The shaded region is the standard error of the mean. The simulated dynamics closely matched the experimental dynamics except at small lengths expanded (L ≲ 3 mm) where the black strain introduced significant image analysis artifacts (see Supplementary S5 Fig).

