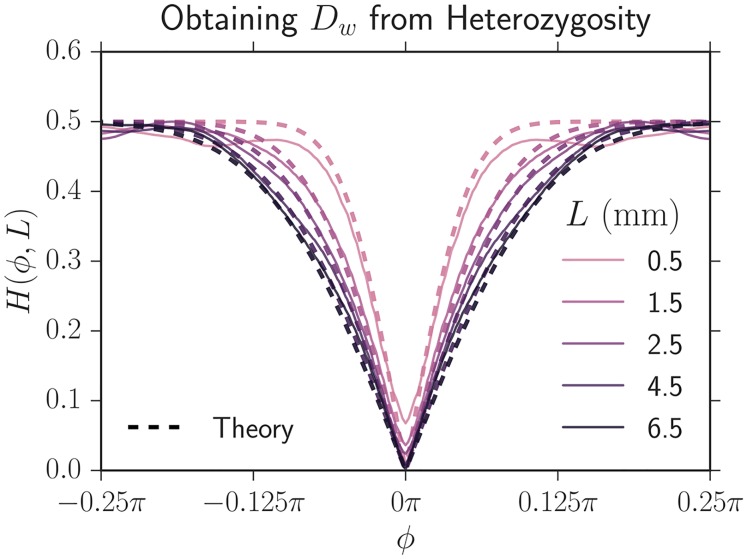
Fig 12. The heterozygosity correlation function H(ϕ, L) (solid lines) obtained by averaging the results of 14 neutral eCFP and eYFP expansions from one set of agar plates at a variety of expansion distances L = R − R0.
The dashed lines are the theoretical fits of the heterozygosity with a constant Dw = 0.100 ± 0.005 mm. The theoretical curves track our experimental data, suggesting that a diffusive approximation to domain boundary motion is justified.

