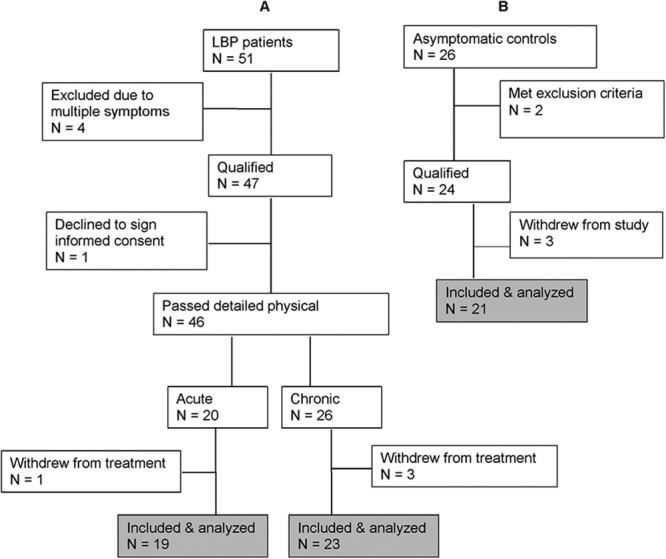
FIGURE 1.

Flow chart of participant enrolment showing process of exclusion and inclusion in the low back pain (A) and control (B) groups.

Flow chart of participant enrolment showing process of exclusion and inclusion in the low back pain (A) and control (B) groups.