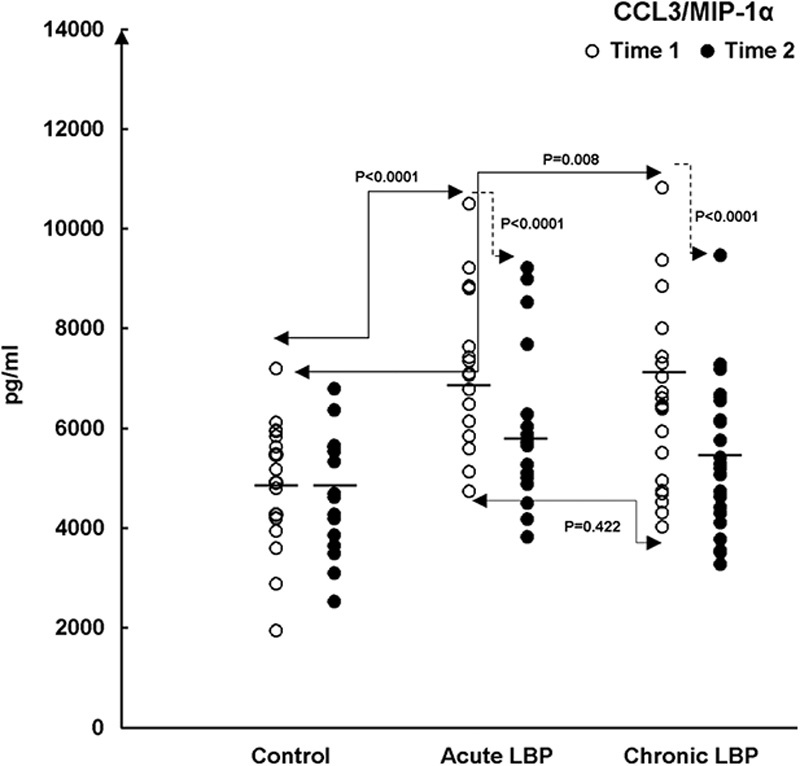
FIGURE 3.

Production of CCL3/MIP-1α in LPS-stimulated WB cultures from the studied LBP patients and asymptomatic patients (Control). Patient cultures were established before the initiation of SMT treatments (baseline, Time 1) and following their completion (Time 2). Control participants were studied within the span of 2 weeks between Time 1 and Time 2. The figure depicts statistical significance of differences in: (A) the baseline levels (Time 1, →) of CCL3 production between control versus acute LBP patients (P<0.0001, Scheffe’s test). At baseline, CCL3 levels trend higher (P=0.008, Scheffe’s test) in patients with chronic LBP (B) SMT-related changes in acute and chronic LBP patient groups compared with changes in asymptomatic patients at Time 2 (→) (P<0.0001 and <0.0001, respectively; Kruskal-Wallis test). The means of chemokine production (—) are shown for each study group. CCL indicates CC chemokine ligand; LBP, low back pain; LPS, lipopolysaccharide; MIP, macrophage inflammatory protein; PHA, phytohemagglutinin; SMT, spinal manipulative therapy; WB, whole blood.
