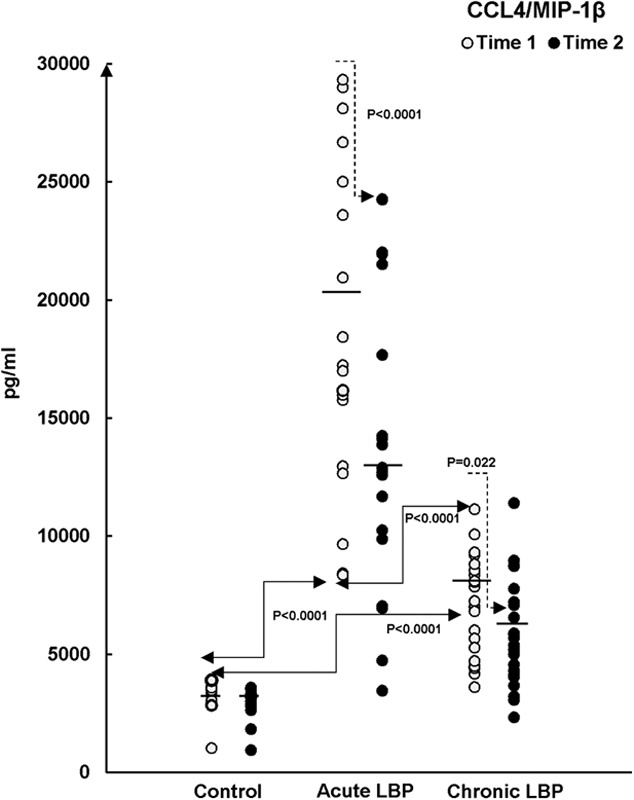
FIGURE 4.

Production of CCL4/MIP-1β in LPS/PHA-activated WB cultures from patients with acute and chronic LBP and asymptomatic participants (Control) at baseline (Time 1) and after 2 weeks during which the patients received SMT treatments (Time 2). The statistical significance of differences is apparent in (A) the baseline levels (Time 1, →) of CCL4 production between all study groups (P<0.0001, Scheffe’s test) and (B) SMT-related changes (Time 2, →) in acute LPB group versus time-related changes in the asymptomatic control group (P<0.0001, Kruskal-Wallis test). The means of chemokine production in all study groups are also shown (—). CCL indicates CC chemokine ligand; LBP, low back pain; LPS, lipopolysaccharide; MIP, macrophage inflammatory protein; PHA, phytohemagglutinin; SMT, spinal manipulative therapy; WB, whole blood.
