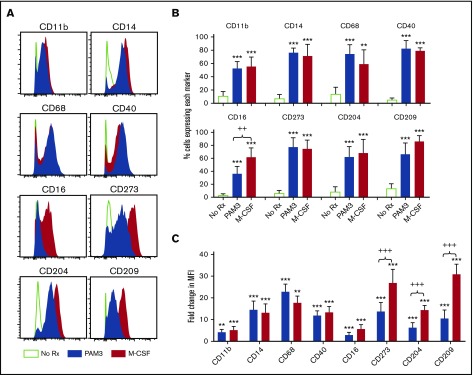
Figure 2.
Phenotype of PAM3 and M-CSF macrophages. Purified monocytes were stimulated in vitro for 5 days. Representative histogram (A), percentage (B), and fold change (C) in median fluorescence intensity (MFI) of cells expressing each surface marker (mean ± standard deviation of 6 independently studied donors per group). Bars show the effect of stimulation with PAM3 (blue), M-CSF (red), or medium alone (open green). **P < .01, ***P < .001 vs unstimulated cultures; ++P < .01, +++P < .001 PAM3 vs M-CSF cultures.

