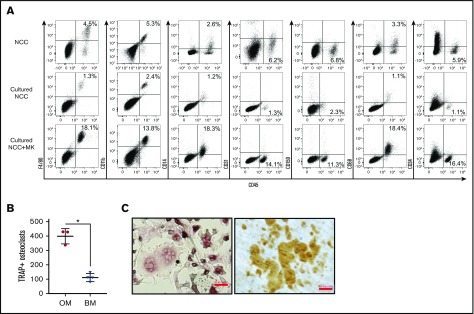
Figure 1.
Phenotypic analysis of fresh and cultured OMs. (A) Representative data from the flow cytometric analysis of freshly isolated NCCs, NCCs cultured alone for 7 days (Cultured NCC), or cultured for 7 days with megakaryocytes (Cultured NCC+MK). In the example shown in the figure, cultures were initiated with 2 × 10⁴ NCCs. On day 7, cultures contained 7 × 10⁴ cells without and 1.8 × 10⁵ cells with megakaryocytes, indicating that the number of CD45+F4/80+ cells in these cultures was ∼900 and 32 500 on day 7, respectively. Staining included CD41 to ensure that only CD41− cells were analyzed. (B) CD45+F/48+ OMs from NCCs or BM cells from long bones were cultured with RANKL and M-CSF to induce osteoclast formation. TRAP+ osteoclasts with ≥3 nuclei were quantified. *P < .05. (C) Osteoclasts formed from the calvariae-derived (left panel) OMs were replated on dentin, and resorption pits were stained after 3 days (right panel). Representative images of TRAP+ osteoclasts and resorption pits formed by these cells are shown. Slides were stained as described in “Materials and methods.” Scale bar indicates 50 μm.

