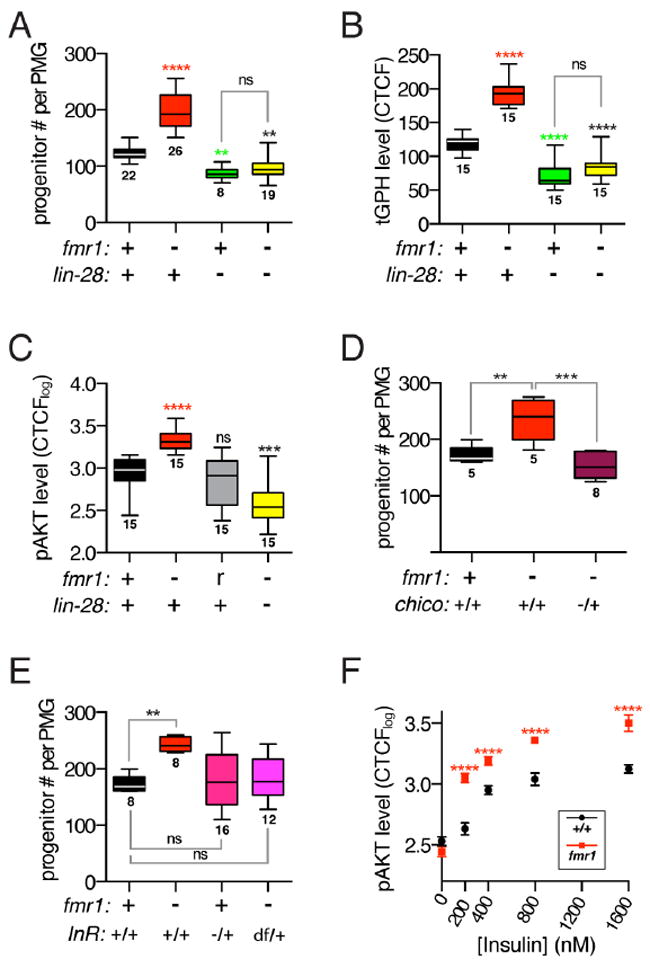
Figure 2. fmr1 regulates insulin signaling via lin-28.

(A) Number of esg+, progenitor cells per control, fmr1Δ50m/Δ113m mutant, lin-28Δ1 mutant or lin-28Δ1, fmr1Δ50m/Δ113m double mutant intestine. (B) Membrane intensity of tGPH reporter in control, fmr1Δ50m/Δ113m mutant, lin-28Δ1 mutant and lin-28Δ1, fmr1Δ50m/Δ113m double mutant progenitor cells. (C) Intensity of p-AKT signal in control, fmr1Δ50m/Δ113m mutant, rescued fmr1Δ50m/Δ113m mutant, and lin-28Δ1, fmr1Δ50m/Δ113m double mutant progenitor cells. (D) Number of esg+, progenitor cells per control, fmr1Δ50m/Δ113m mutant, or fmr1Δ50m/Δ113m, chico1/+ mutant intestine. (E) Number of esg+, progenitor cells per control, fmr1Δ50m/Δ113m mutant, fmr1Δ50m/Δ113m; InRE19/+ mutant, or fmr1Δ50m/Δ113m; InR Df(3R)Exel6186/+ mutant intestine. (F) Intensity of p-AKT signal in control and fmr1Δ50m/Δ113m mutant progenitor cells in intestines treated with increasing concentrations of insulin. Error bars indicate SEM. (A-F) Significance of control versus mutant comparisons as well as numbers of samples are indicated except for (F) where numbers of samples are listed in methods section. See also Figure S2.
