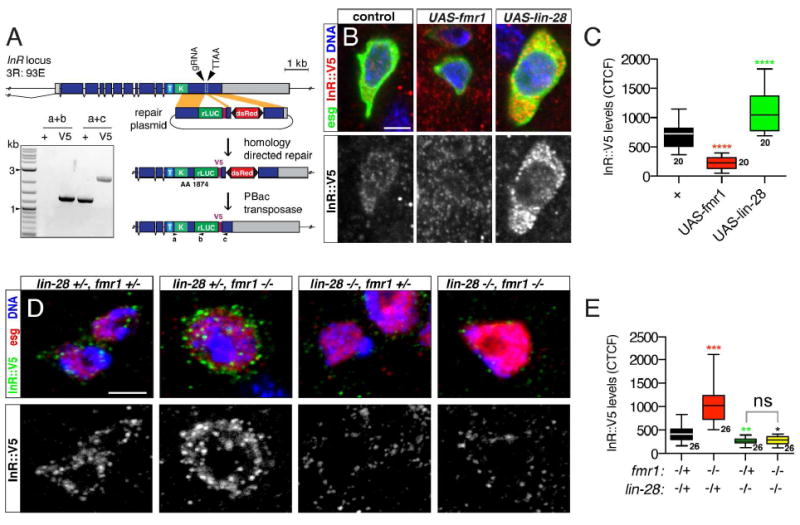
Figure 3. fmr1 and lin-28 have opposing effects on InR levels.

(A) InR∷V5 construction scheme. See methods for full description. Inset: PCR-based confirmation of InR tagging. (B) Intestinal progenitors from esgTS (control), esgTS/UAS-fmr1 and esgTS/UAS-lin-28 intestines stained for esg>GFP (green), InR∷V5 (red), and DNA (blue). Scale bar: 3 μm. (C) InR∷V5 fluorescence intensity of samples shown in (B). (D) Intestinal progenitors stained for InR∷V5 (green), esg-LacZ (red) and DNA (blue) from adults harboring mutations in one or both copies of lin-28 and fmr1. Scale bar: 3 μm. (E) InR∷V5 fluorescence intensity of samples shown in (D). Significance of control versus mutant comparisons as well as numbers of samples indicated. See also Figure S3.
