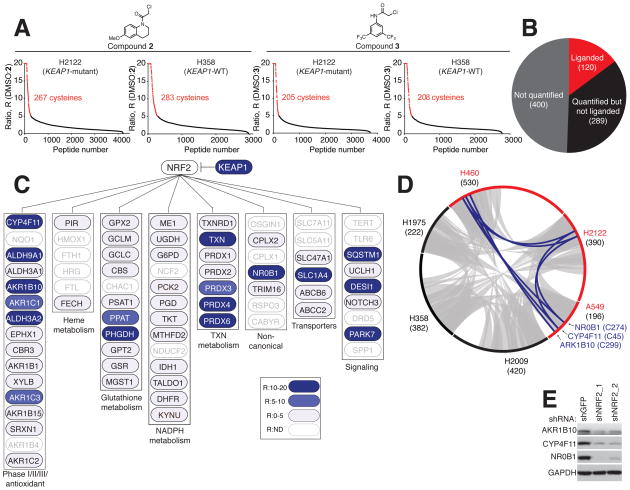
Figure 2. Cysteine ligandability mapping of KEAP1-mutant and KEAP1-WT NSCLC cells.
A) isoTOP-ABPP ratios (R values; DMSO/compound) for cysteines in H2122 cell (KEAP1-mutant) and H358 cell (KEAP1-WT) proteomes treated with DMSO or ‘scout’ fragments 2 or 3 (500 μM, 1 h). Red data points mark R values ≥ 5, which was used as a cutoff for defining liganded cysteines. Average R values from n = 3 biological replicates per group are shown. See also Table S3.
B) Pie chart of NRF2-regulated genes/proteins in NSCLC cell lines denoting the subset that contain liganded cysteines (red).
C) Cysteine ligandability map for representative NRF2 pathways. Blue marks proteins with liganded cysteines in NSCLC cells. ND, not detected.
D) Circos plot showing the overlap in liganded cysteines between KEAP1-mutant (red) and KEAP1-WT (black) NSCLC cells. Gray and blue chords represent liganded cysteines found in both KEAP1-WT and KEAP1-mutant cell lines and selectively in KEAP1-mutant cell lines, respectively. Numbers in parenthesis indicate total liganded cysteines per cell line.
E) Immunoblot of AKR1B10, CYP4F11 and NR0B1in shNRF2- and shGFP- H2122 cells.

