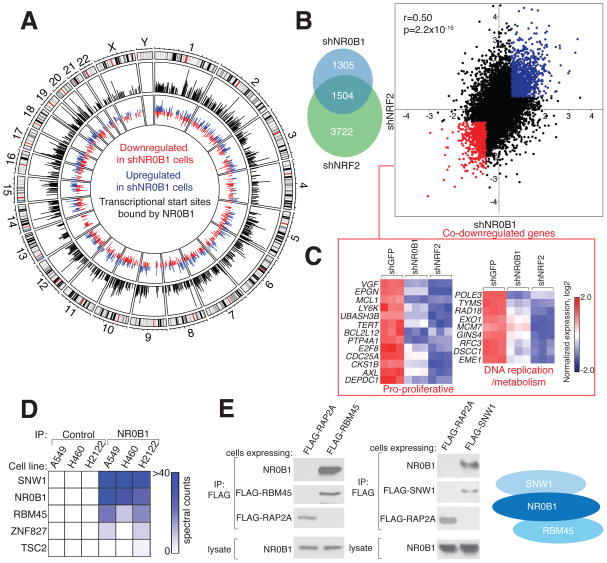
Figure 4. NR0B1 nucleates a transcriptional complex that supports the NRF2 gene-expression program.
A) Intersection between NR0B1-regulated genes and transcriptional start sites (TSSs) bound by NR0B1. Outer circle: Chromosomes with cytogenetic bands. Middle circle: Whole genome plot of mapped NR0B1 reads (black) determined by ChIP-Seq corresponding to the transcriptional start sites (TSSs) of genes differentially expressed (up- (blue) or down- (red) regulated > 1.5-fold) in shNR0B1-H460 cells compared to shGFP-H460 cells (inner circle). See also Table S2.
B) Overlap (left) and correlation (right) between genes up- (red) or down- (blue) regulated (> 1.5-fold) in shNR0B1- and shNRF2-H460 cells compared to shGFP-H460 control cells. r and p values were determined by Pearson correlation analysis.
C) Heat map depicting RNAseq data for the indicated genes in shNR0B1-, shNRF2-, or shGFP-H460 cells. Expression was normalized by row. See also Table S2.
D) Heat map representing NR0B1-interacting proteins in NSCLC cells.
E) Endogenous NR0B1 co-immunoprecipitates with FLAG-RBM45 and FLAG-SNW1, but not control protein FLAG-RAP2A, in H460 cells, as determined by immunoblotting (left); right: schematic of NR0B1 protein interactions.

