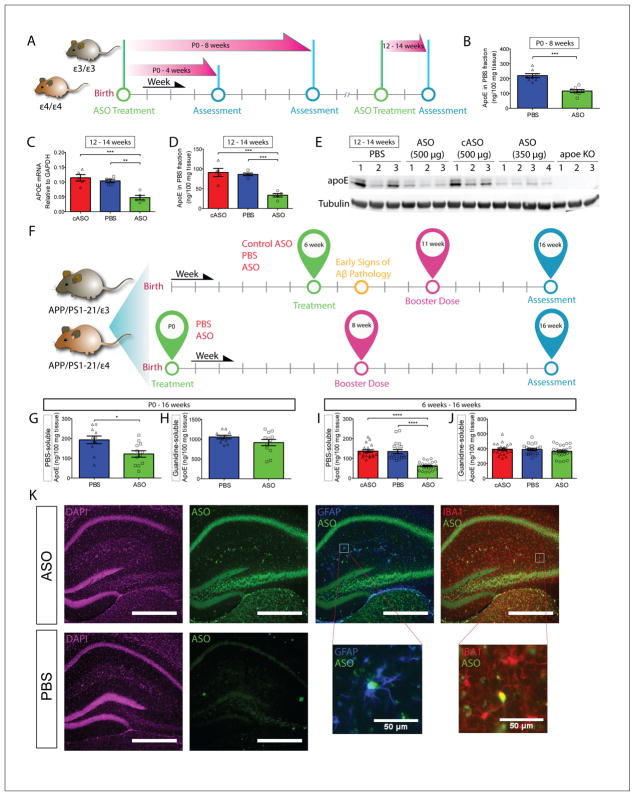
Figure 1. ASO Treatment reduces apoE mRNA and protein levels in APPE4 mice.
A, Timeline of various experimental approaches to test for efficacy and optimal dosing of the ASO. B, E4KI mice were treated with a single bolus of ASO or PBS at P0, and the PBS-soluble apoE levels in the ipsilateral cortex were assessed at 8 weeks (n = 7 – 8 per group, p = 0.0003). C, 3 – 4 mo E4KI mice were treated with cASO, PBS or ASOs (n = 5 per group) and apoE mRNA level in the ipsilateral posterior cortex was analyzed 2 weeks later (p = 0.0002, F = 18.56). D, PBS-soluble apoE levels were measured in brain lysates from the same cohort (p < 0.0001, F = 22.38). E, Western blot for apoE from the same cohort using anti-apoE antibody HJ15.7. F, Experimental timelines for APPE4 and APPE3 cohorts. G, PBS-soluble apoE levels in the contralateral cortex of P0 APPE4 mice were assessed at 4 mo (n = 9 – 12 per group, p = 0.0129). H, Guanidine-soluble apoE levels in the contralateral cortex were assessed from the same cohort (p = 0.2844). I, ApoE protein levels in the contralateral cortex from 6wk APPE4 mice were measured via ELISA (n = 20 – 25 per group, p < 0.0001, F = 35.64). J, Guanidine-soluble ApoE protein levels were measured from the same set of brain homogenates (p = 0.4316, F = 0.8524). K, Immunofluorescent staining of ASO- and PBS-treated brains from APPE4 mice. ASOs (green) are taken up by both astrocytes (blue) and microglia (red), as indicated by co-localization with GFAP and Iba1, respectively. Scale bars = 500 μm, unless otherwise noted. *p < 0.05, **p < 0.01, ***p < 0.001, ****p < 0.0001. All values are reported as mean ± SEM. See also figure S1.

