
Fig. 1. MRI scan.
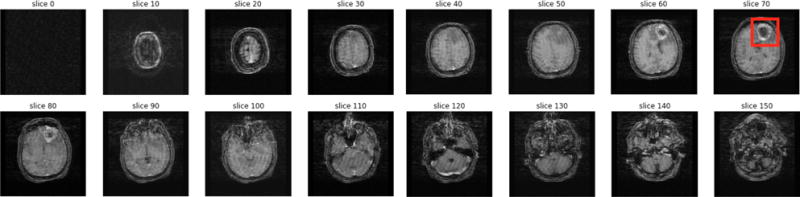
A visualization of different MRI image frames in one MRI scan, with the GBM tumor highlighted in red on slice 70.
Official websites use .gov
A
.gov website belongs to an official
government organization in the United States.
Secure .gov websites use HTTPS
A lock (
) or https:// means you've safely
connected to the .gov website. Share sensitive
information only on official, secure websites.
A visualization of different MRI image frames in one MRI scan, with the GBM tumor highlighted in red on slice 70.