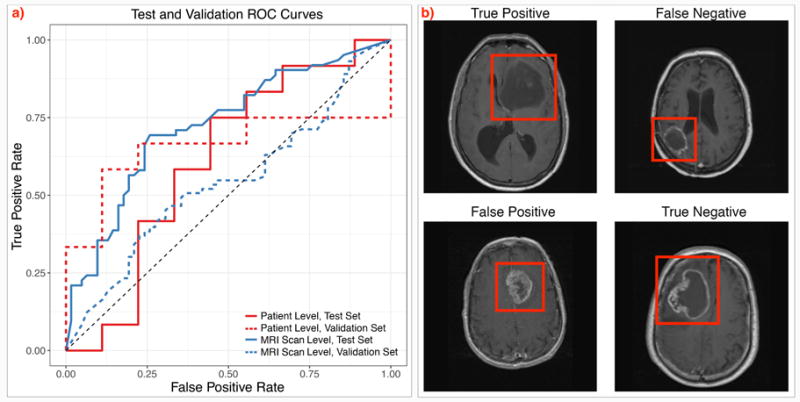
Fig. 4. Evaluation of the CRNN method.

a) ROC curves depicting results at the patient and MRI scan levels in the validation and held-out test set, and b) Classifier prediction examples. True positive, true negative, and misclassified false positive and false negative examples from our test set. The tumors are highlighted in the red boxes.
