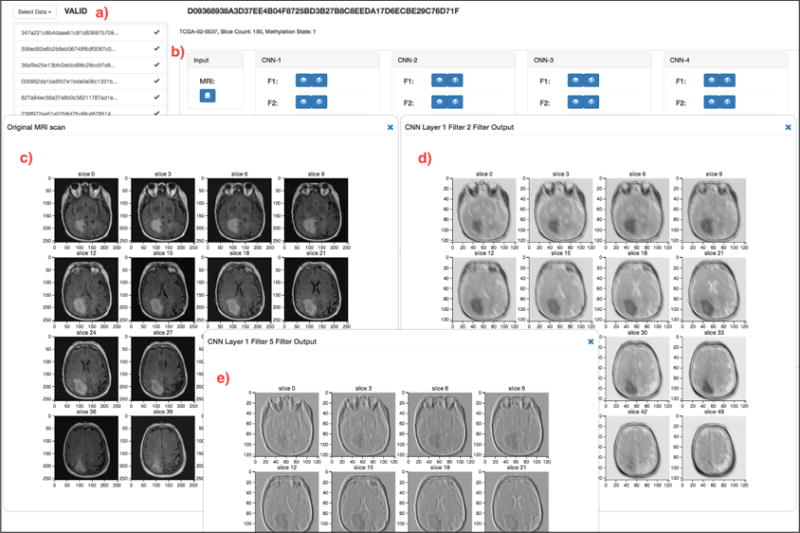
Fig. 5. CRNN Visualization Interface.

(a) The domain user can select any MRI scan to load into the Tensorflow CRNN pipeline. (b) After the pipeline completes the computation to predict the MGMT methylation status, the user can visualize the original MRI Scan (c), the output from any filter, in each convolutional layer (d, e), as well as the output after ReLU activation.
